

Here’s the short answer. The Google Ads geographic report shows where your ads actually matched people — by targeted location or by matched location (physical presence or location of interest) — so you can see which cities, regions or postal codes burn budget without converting. Open it under Campaigns → Insights & reports → When and where your ads showed → Matched locations, then sort by cost and conversions. For most local service businesses, the fix is not “more budget”; it is excluding wasteful geos and tightening Presence targeting so you stop paying for clicks from places you never drive to.
I write this for owners who already set location targeting and still feel ads are “showing everywhere.” Setup and Presence vs Presence-or-interest live in my guide to Google Ads location targeting. This post is the companion: how to read the live geographic data, what “matched” really means, how to use exclusions, and a monthly routine that keeps local spend honest.
Owners sometimes confuse the geographic report with the locations settings screen. Settings are where you choose targets and exclusions. The report is where you prove whether those choices match reality. I open settings when I need to change something; I open the report when I need evidence. If your account has several local campaigns (brand, generics, competitors), review each campaign’s matched locations separately — a competitor campaign can look “national” in the aggregate view even when generics are clean.
What the geographic report actually measures
Google’s About measuring geographic performance page explains two location views:
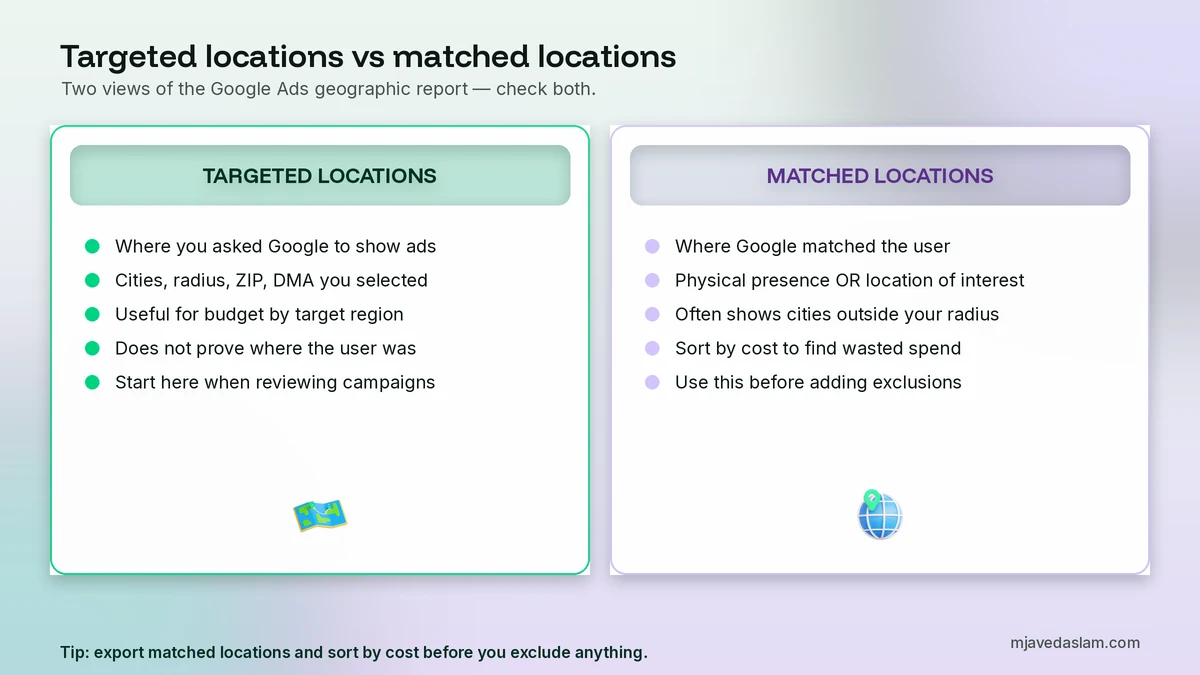
- Targeted locations: performance broken down by the locations you chose to target (countries, regions, cities, postal codes or radius targets).
- Matched locations: performance based on the locations that matched your ads. Those can be the user’s physical location or a location they showed interest in (for example searching “plumber in Lahore” while sitting in another city).
That second view is where local advertisers get surprised. Your campaign might target a 25 km radius around your shop, yet matched locations show clicks attributed to cities far outside that radius because interest-based signals matched the query. The report is doing its job — showing where Google matched the ad — not proving your radius setting is broken.
Google also notes a Most specific location column with the most detailed match available, and an Unspecified bucket when IP or query signals are not clear enough. Metrics below country level may not sum to campaign totals because some impressions are only matched at country level.
How to open the matched locations report
Per Google’s View matched locations and distance reports help:
- Go to Campaigns → Insights & reports → When and where your ads showed.
- Open the Matched locations tab along the horizontal tabs.
- Set a date range long enough to matter (I usually use the last 30 days once the campaign has volume, or since launch for new accounts).
- Add columns you care about: cost, conversions, conversion rate, cost per conversion, clicks, impression share if available.
- Segment or filter by the campaign you’re investigating so national brand campaigns don’t muddy a local one.
You can also build the same breakdowns in Report editor with location dimensions such as User location or Matched locations if you want a saved custom view.
Targeted locations vs matched locations: which tab to trust
Use both, for different questions:
- Targeted locations answers: “Of the places I asked Google to cover, which ones convert?” Useful when you target a list of cities or postal codes and want to cut the weak ones.
- Matched locations answers: “Where did Google actually match the user?” Essential when Presence or interest is on, when queries name cities, or when you suspect leakage.
If Presence or interest is enabled, matched locations outside your service area are expected. Google’s location targeting help describes broad geo targeting (Presence or interest) as reaching people who are in your locations or interested in them. For a plumber who only drives 20 km, that setting often buys tourist and out-of-town research traffic. Switch to Presence for people in or regularly in your targeted locations, then re-check matched locations after a week of data.
What to look for in the first 15 minutes
Sort matched locations by cost descending. Then scan:
- High cost, zero or near-zero conversions. First exclusion candidates — unless the location is brand-new and still learning.
- High cost, conversions that never become jobs. Pull call recordings or CRM notes. Geographic “conversions” can still be wrong-intent if your conversion action is soft.
- Cities you do not serve. Even a few expensive clicks a week add up. Exclude them at campaign level.
- Your core city converting well. Protect that budget. Don’t choke a winner while chasing vanity coverage.
- Unspecified. Some volume is normal. A huge share of cost in Unspecified means you need tighter targeting and better query/geo alignment, not a spreadsheet panic.
Download the table (export) and keep a simple monthly sheet: location, cost, conversions, cost per conversion, keep / exclude / watch. That habit beats staring at the UI once and forgetting.
How to turn the report into exclusions (without wrecking reach)
Exclusions are the practical payoff of the geographic report:
- From campaign settings → Locations (or the locations tool), add location exclusions for cities, regions or postal codes that repeatedly spend without value.
- Exclude the obvious non-service areas first (other provinces, far metros), not your entire neighbouring town on one bad week.
- After excluding, give the campaign several days. Then reopen matched locations and confirm spend shifted toward your keep list.
- Pair exclusions with the right advanced location option (Presence vs Presence or interest). Exclusions alone won’t fix interest-based matches if the setting still invites them.
Google’s targeting documentation also covers radius targets (minimum 1 km) and bulk location edits. For local trades I prefer a realistic city/postal code list or a radius that matches drive time, plus exclusions for known money pits, over “whole country minus a few places.”
Distance reports (when you use location assets)
If you use location assets, Google’s distance report shows performance by how far the triggering location was from your closest business location. Path from the help page: Insights & reports → Report editor → pick the campaign → Predefined reports → Locations → Distance.
A classic pattern: conversion rate is strong within 5–10 km and collapses beyond that. Raise bids or sharpen radius for the inner band; stop pretending a 50 km ring is “coverage” if nobody books past 15 km. Google warns distance figures can look larger than your radius because interest locations (not only GPS presence) feed the distance calculation.
Geographic report vs Search terms and negatives
Geo waste and query waste often arrive together. Someone outside your area searching a cheap related term can still match. After you trim geos:
- Review search terms for irrelevant jobs and add negative keywords.
- Confirm conversion actions still measure real leads — see conversion tracking for WordPress if form or call tracking is shaky.
- If Local Services Ads cover your core jobs in-area, keep Search focused on gaps rather than buying the whole map. Context: Local Services Ads vs Google Ads.
A simple monthly geographic review routine
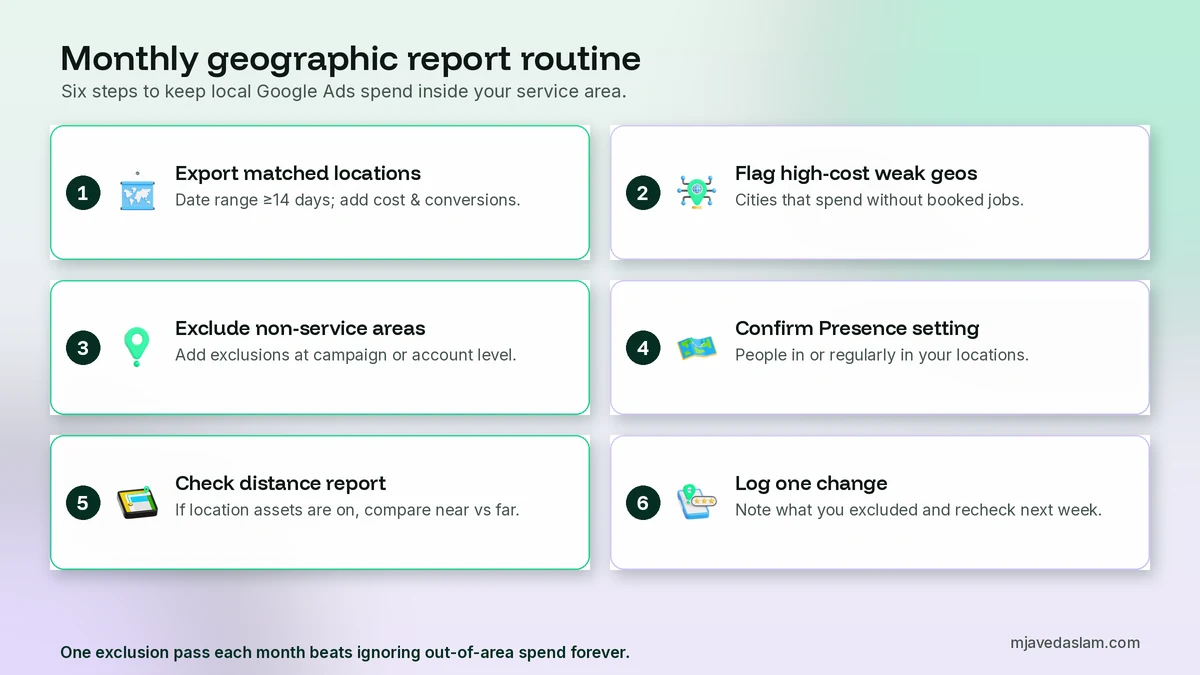
- Export matched locations for the last 30 days for each local campaign.
- Flag rows with meaningful cost and weak or zero conversions.
- Exclude clear non-service geos; mark borderline towns as watch.
- Confirm Presence vs Presence or interest still matches how you sell.
- Spot-check distance report if you use location assets.
- Note one change in your log (exclusion list or radius) so you can judge impact next month.
Do this on a calendar reminder. Geographic creep is quiet — a new city appears in matched locations after a settings reset, a recommendation, or a campaign duplicate, and the credit card notices before you do.
Why numbers disagree with your analytics
Google lists several reasons geographic figures differ from web logs or third-party tools: different update schedules for IP data, invalid-click filtering, location-of-interest matches other tools miss, and other traffic sources counted in site analytics. For invoicing, trust Google Ads billing reports. For optimisation, use the geographic report as a relative guide inside Google Ads — which geos deserve budget — not as a courtroom exhibit against GA4 session counts.
Common mistakes I see in local accounts
- Never opening matched locations after launch.
- Targeting an entire country “for impressions,” then wondering why CPA exploded.
- Leaving Presence or interest on for a radius-only trade.
- Excluding a converting suburb because of one expensive weekend.
- Judging geos on clicks alone without conversions or booked jobs.
- Fixing geo while conversion tracking still counts button taps as leads.
Worked example: reading a local plumber’s matched locations
Imagine a plumber targeting a 30 km radius on Presence, spending about a modest daily budget. Matched locations for 30 days might show:
- Home city: 55% of cost, most conversions, acceptable cost per lead.
- Two neighbouring towns inside the drive radius: 25% of cost, decent conversion rate.
- A large metro 80 km away: 12% of cost, clicks but almost no booked jobs — often interest queries naming that metro or leaked settings.
- Unspecified: 8% of cost.
Action: exclude the far metro, confirm Presence is still selected, keep the neighbouring towns, and leave Unspecified alone unless it grows. Next month, check that the metro’s cost dropped near zero and home-city volume held. That is geographic reporting as a management tool, not a once-a-year curiosity.
If the far metro only appeared after someone switched the campaign to Presence or interest “to get more traffic,” switch it back. Volume that cannot become a job is not a gift.
Campaign types and where geographic reporting helps most
Search campaigns are the clearest: keywords plus geo decide almost everything. Performance Max for local business and other automated campaigns still expose location views, but you have fewer levers mid-flight — which makes getting Presence right at launch even more important. Shopping and ecommerce national campaigns use geographic reports differently (shipping regions, profitable states). This article stays on local service and storefront accounts where wasted geo is usually neighbouring cities, not continents.
For Local Services Ads, Google matches by the service area and category you set inside that product; you do not manage it like a Search location report. When LSA migrates into Google Ads as pay-per-lead Performance Max, keep using the LSA/lead tools for lead quality, and use classic geographic reports on your remaining Search (and any standard Performance Max) budgets.
Checklist before you change anything
- Is conversion tracking trustworthy this month?
- Is the date range long enough to avoid weekend noise?
- Am I looking at the local campaign only, not the whole account?
- Have I checked Presence vs Presence or interest?
- Will this exclusion remove a town we still serve for big jobs?
- Did I write down the change so next month’s review has a baseline?
Skip any change that fails those checks. Bad exclusions are harder to notice than bad keywords because nobody “searches” for a city in your negative list — the leads simply stop.
Frequently asked questions
What is the Google Ads geographic report?
It is the set of location views in Google Ads that show performance by geography. The targeted locations view breaks results down by the places you chose to target. The matched locations view shows where ads actually matched users — either their physical location or a location they showed interest in.
Where do I find matched locations in Google Ads?
Go to Campaigns, then Insights & reports, then When and where your ads showed, and open the Matched locations tab. Set a useful date range, add cost and conversion columns, and filter to the campaign you care about.
Why do I see cities outside my radius in the geographic report?
Matched locations can include locations of interest, not only GPS presence. If someone outside your radius searches for a service in your city, or if Presence or interest targeting is on, those matches can appear as far-away cities even when your targets look correct.
Should local businesses use Presence or Presence or interest?
Most local service businesses that only serve people who can book an in-area job should use Presence (people in or regularly in your targeted locations). Presence or interest is better when you want people elsewhere who are researching your city, such as hotels or tourism offers.
How do I stop wasting spend in bad geographic areas?
Export matched locations, sort by cost, exclude cities or regions that spend without conversions you value, and confirm your advanced location option is Presence when appropriate. Recheck the report after a week to confirm spend moved toward your service area.
What is the Google Ads distance report?
If you use location assets, the distance report shows performance by how far the location that triggered the ad was from your closest business location. Open it from Insights & reports → Report editor → Predefined reports → Locations → Distance. Use it to see whether closer customers convert better.
Next step
Open matched locations on your main local campaign today, sort by cost, and exclude one clearly useless geo this week. Then confirm Presence targeting in settings so the report stays clean. If you want a second pair of eyes on geo, exclusions and conversion goals before the next billing cycle, see my Google Ads management service — and keep location targeting bookmarked as the setup twin to this reporting guide.